

Instructions:
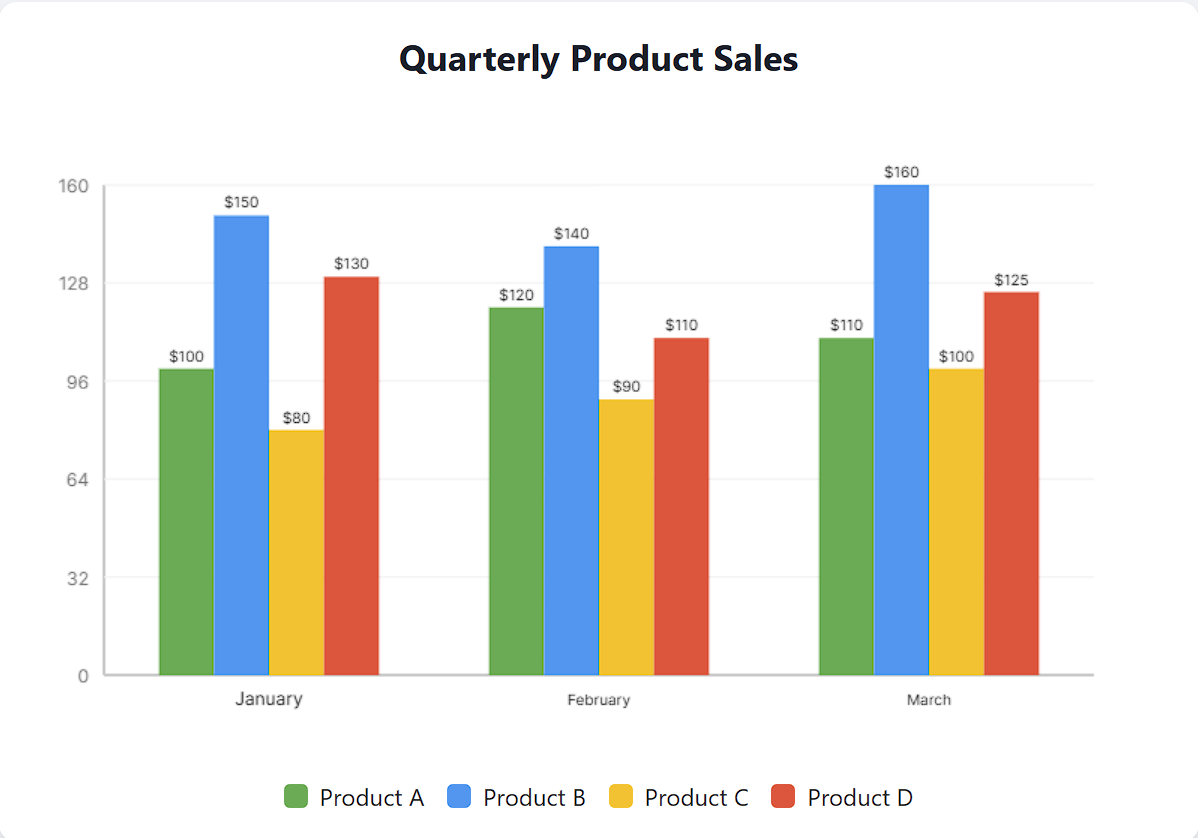
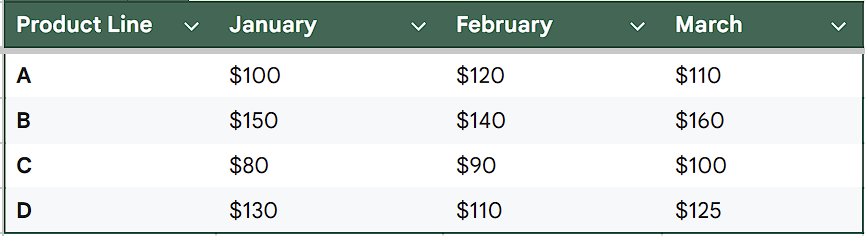
The following graph and table display monthly sales data for four different product lines (A, B,C, and D) over a three-month period. Use the information provided to answer the questions below.
What was the total sales amount for all product lines in February?
Correct!
Wrong!
Which product line experienced the greatest percentage increase in sales from January to February?
Correct!
Wrong!
In which month was the sales difference between Product B and Product D the largest?
Correct!
Wrong!
What was the average monthly sales for Product B over the three-month period?
Correct!
Wrong!
True or False: The total sales in March were greater than the total sales in January.
Correct!
Wrong!
GMAT Integrated Reasoning: Graphics Interpretation 1
Well Done!
Keep Practicing!
Try Try Again!
Share your Results:
For answer key click me.