

Instructions:
The following graph and table display the number of units sold per quarter for four different product lines (P1, P2, P3, and P4) over a one-year period. Use the information provided to answer the questions below.
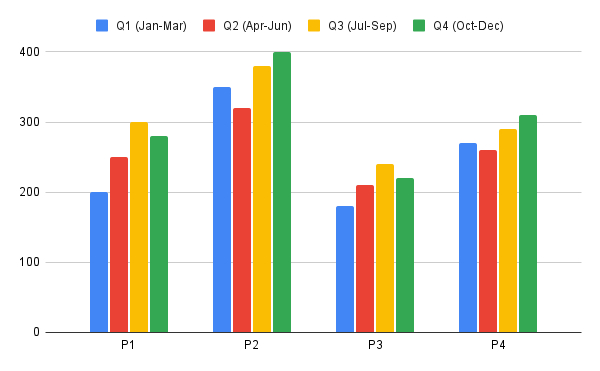
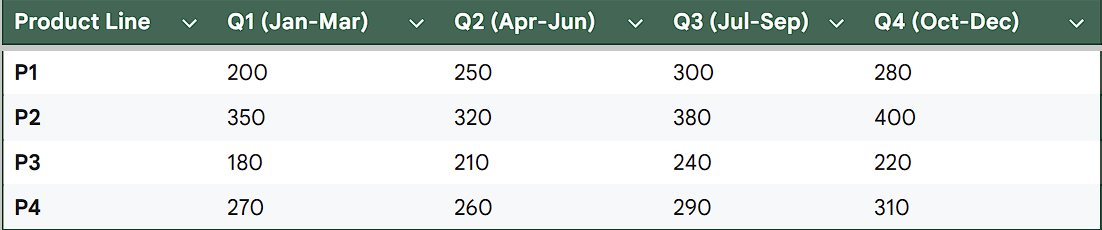
What was the total number of units sold for all product lines in Quarter 4 (Q4)?
Correct!
Wrong!
Which product line had the largest percentage increase in sales from Q2 to Q3?
Correct!
Wrong!
In which quarter was the sales difference between Product P1 and Product P4 the smallest?
Correct!
Wrong!
What was the average quarterly sales for Product P2 over the one-year period?
Correct!
Wrong!
True or False: The sales for Product P3 in Q3 were greater than the combined sales of Product P1 and P4 in Q1.
Correct!
Wrong!
GMAT Integrated Reasoning: Graphics Interpretation 2
Try Try Again!
Keep Practicing!
Well Done!
Share your Results:
For answer key click me.